Read The Freaking Manual! - Chairman Mao
If you are a developer, you know it is frustrating when users request “new” features that are in fact already in the application, especially when you spent countless hours developing them. Usually they are the same people that requested them in the first place! You just want to tell them: “Dude, just RTFM!”.
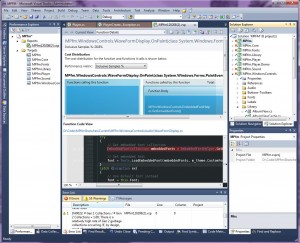
That happened to me today when I searched for an efficient way to monitor the performance of MPfm and pin point where I could optimize the code. I looked for articles about performance monitoring tools on Stack Overflow and quickly realized I already had this tool right before my eyes in Visual Studio! It is called the Visual Studio Profiler (available through the Analyze > Launch Performance Wizard menu item). It is quite awesome for Windows Forms applications and other kinds of projects. If you haven’t discovered it yet, you really should give it a try. If you’re like me, you’ll feel a bit ashamed you ignored that Analyze menu all these years.
It is a great tool to analyse the bottlenecks of your application. It runs while you are debugging the application using Visual Studio, and generates a nice report after the profiling session is done. The report tells you immediately what are the top bottlenecks and where they are located in the code. I got to admit that my jaw dropped when I saw the Function Code View in the Function Details section. The background color changes depending on how many CPU resources were used to execute that line of code.
I now have a good idea where to optimize CPU usage in MPfm! That unfortunately means more work to do…
For a quick how-to on the Visual Studio Profiler, check this MSDN article.
Have fun with MPfm!
Tags: RTFM, Visual Studio Profiler

Recent Comments